How to Read and Analyze DMARC Reports (With Examples)
A DMARC report is an XML file that shows which servers are sending email using your domain and whether those messages passed SPF and DKIM.

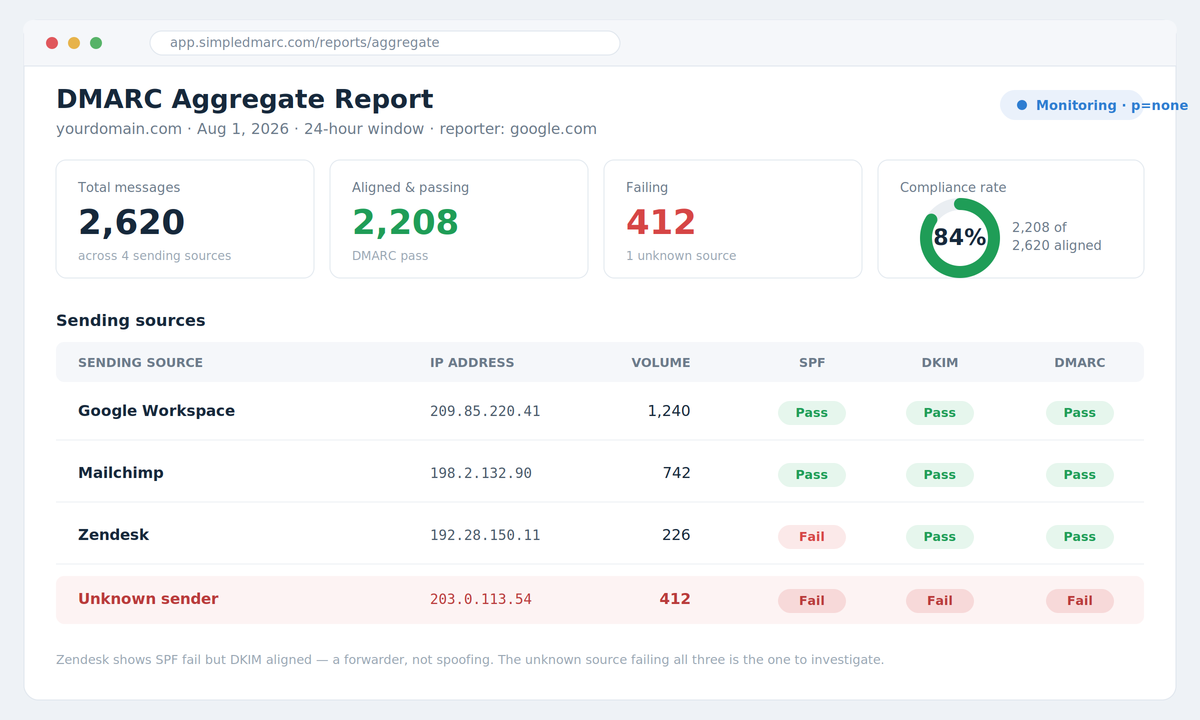
This guide shows you how to read DMARC reports — both aggregate and failure types — decode each field with a real example, and turn that data into a safe path toward enforcement.
Updated: July 2026
Why reading DMARC reports matters
When you publish a DMARC record set to p=none, you're not protected yet — you're in monitoring mode. The reports that start arriving are the entire point of that mode. They tell you who is sending email as your domain, which of those senders are legitimate, and which are spoofing you.
Skip this step and you're stuck with two bad options. Stay at p=none forever and you get reports but no protection. Jump straight to p=reject without reading anything and you'll block your own legitimate mail — invoices from your billing platform, campaigns from your marketing tool, alerts from your monitoring service.
Reading the reports is how you avoid both traps. You confirm every real sender is authenticated, then tighten your policy knowing exactly what will happen. Before any of that, make sure your record is actually requesting reports — you can confirm the rua tag is present with a free DMARC checker.
The two types of DMARC reports: aggregate vs failure
DMARC produces two report types, and they answer different questions. Both are requested through tags in your DMARC record: rua for aggregate reports, ruf for failure (also called forensic) reports.
Aggregate report (rua) |
Failure report (ruf) |
|
|---|---|---|
| Format | XML summary | Individual message details |
| Frequency | Usually once per day | Sent at the time of failure |
| Contains | Counts by sending IP, SPF/DKIM results, disposition | Header and message-level detail of a failing message |
| Privacy | Safe — no message content or personal data | May contain personal data; many providers don't send them |
| Use it to | See all your sending sources and spot trends | Investigate a specific failure in detail |
For nearly all day-to-day work, the aggregate report is what you'll live in. It gives you the full map of who sends mail for your domain. Failure reports are rarer — most large receivers no longer send them for privacy reasons — so the rest of this guide focuses on reading the aggregate report, which is where the real analysis happens.
How to make sure you're receiving reports
You only get reports if your DMARC record asks for them. Aggregate reports go to the address in the rua tag, and failure reports to the ruf tag. A minimal record that requests aggregate reports looks like this:
v=DMARC1; p=none; rua=mailto:dmarc@yourdomain.com
If your record has no rua tag, nothing will arrive no matter how long you wait. You can build or update a valid record — with the reporting address included — using our DMARC record generator, then publish it as a TXT record at _dmarc.yourdomain.com. Reports usually start arriving within 24 to 72 hours.
How to read a DMARC aggregate report (with an example)
Raw aggregate reports arrive as XML, and the format is standardized — it's defined in RFC 7489, so every provider's report looks the same. Here's a trimmed real-world example for one sending source:
<?xml version="1.0" encoding="UTF-8"?>
<feedback>
  <report_metadata>
    <org_name>google.com</org_name>
    <email>noreply-dmarc-support@google.com</email>
    <report_id>1234567890123456789</report_id>
    <date_range>
      <begin>1722384000</begin>
      <end>1722470400</end>
    </date_range>
  </report_metadata>
  <policy_published>
    <domain>yourdomain.com</domain>
    <adkim>r</adkim>
    <aspf>r</aspf>
    <p>none</p>
    <sp>none</sp>
    <pct>100</pct>
  </policy_published>
  <record>
    <row>
      <source_ip>209.85.220.41</source_ip>
      <count>27</count>
      <policy_evaluated>
        <disposition>none</disposition>
        <dkim>pass</dkim>
        <spf>pass</spf>
      </policy_evaluated>
    </row>
    <identifiers>
      <header_from>yourdomain.com</header_from>
    </identifiers>
    <auth_results>
      <dkim>
        <domain>yourdomain.com</domain>
        <result>pass</result>
      </dkim>
      <spf>
        <domain>yourdomain.com</domain>
        <result>pass</result>
      </spf>
    </auth_results>
  </record>
</feedback>
The file breaks into three parts. Here's what each field is telling you.
Report metadata — who sent the report and when.
org_name— the receiver that generated the report (here, Google). Reports come from the mailbox providers your mail reached, not from you.date_range— the window the report covers, in Unix timestamps. The example covers one 24-hour day.
Policy published — the DMARC settings you had live.
p— your policy during this window:none,quarantine, orreject. This example was in monitoring mode (none).adkim/aspf— alignment mode,rfor relaxed orsfor strict. Relaxed is the safe default for most senders.pct— the percentage of mail the policy applied to.
Record — the actual sending activity. This is what you analyze.
source_ip— the server that sent the mail. Your job is to recognize it: is this your mail platform, or a stranger?count— how many messages this IP sent in the window. Here, 27.disposition— what the receiver actually did with the mail (none,quarantine, orreject).policy_evaluateddkim/spf— whether the message passed DMARC, which requires the check to pass and align with the domain in the visible From address.header_from— the domain in the From address the recipient sees.auth_results— the raw SPF and DKIM results before alignment is considered.
In this example, everything passes and aligns, so this is a healthy, authorized sender. Reading a real report means scanning row after row like this and sorting each sending IP into one of three buckets: known and passing, known but failing, or unknown.
Now compare that to a problem source. Here's a second record from the same report:
<record>
  <row>
    <source_ip>203.0.113.54</source_ip>
    <count>412</count>
    <policy_evaluated>
      <disposition>none</disposition>
      <dkim>fail</dkim>
      <spf>fail</spf>
    </policy_evaluated>
  </row>
  <identifiers>
    <header_from>yourdomain.com</header_from>
  </identifiers>
  <auth_results>
    <dkim>
      <domain>yourdomain.com</domain>
      <result>fail</result>
    </dkim>
    <spf>
      <domain>mail.suspicious-host.example</domain>
      <result>fail</result>
    </spf>
  </auth_results>
</record>
Three things mark this as spoofing rather than a forwarder. The source_ip is one you don't recognize, both DKIM and SPF fail, and the SPF domain in auth_results belongs to a stranger's host — yet header_from still claims yourdomain.com. A forwarder normally keeps DKIM aligned; this passes nothing. And because the policy was p=none, the disposition is none, so all 412 of these spoofed messages were still delivered to inboxes. That single row is the argument for moving to p=reject once your legitimate senders are clean.
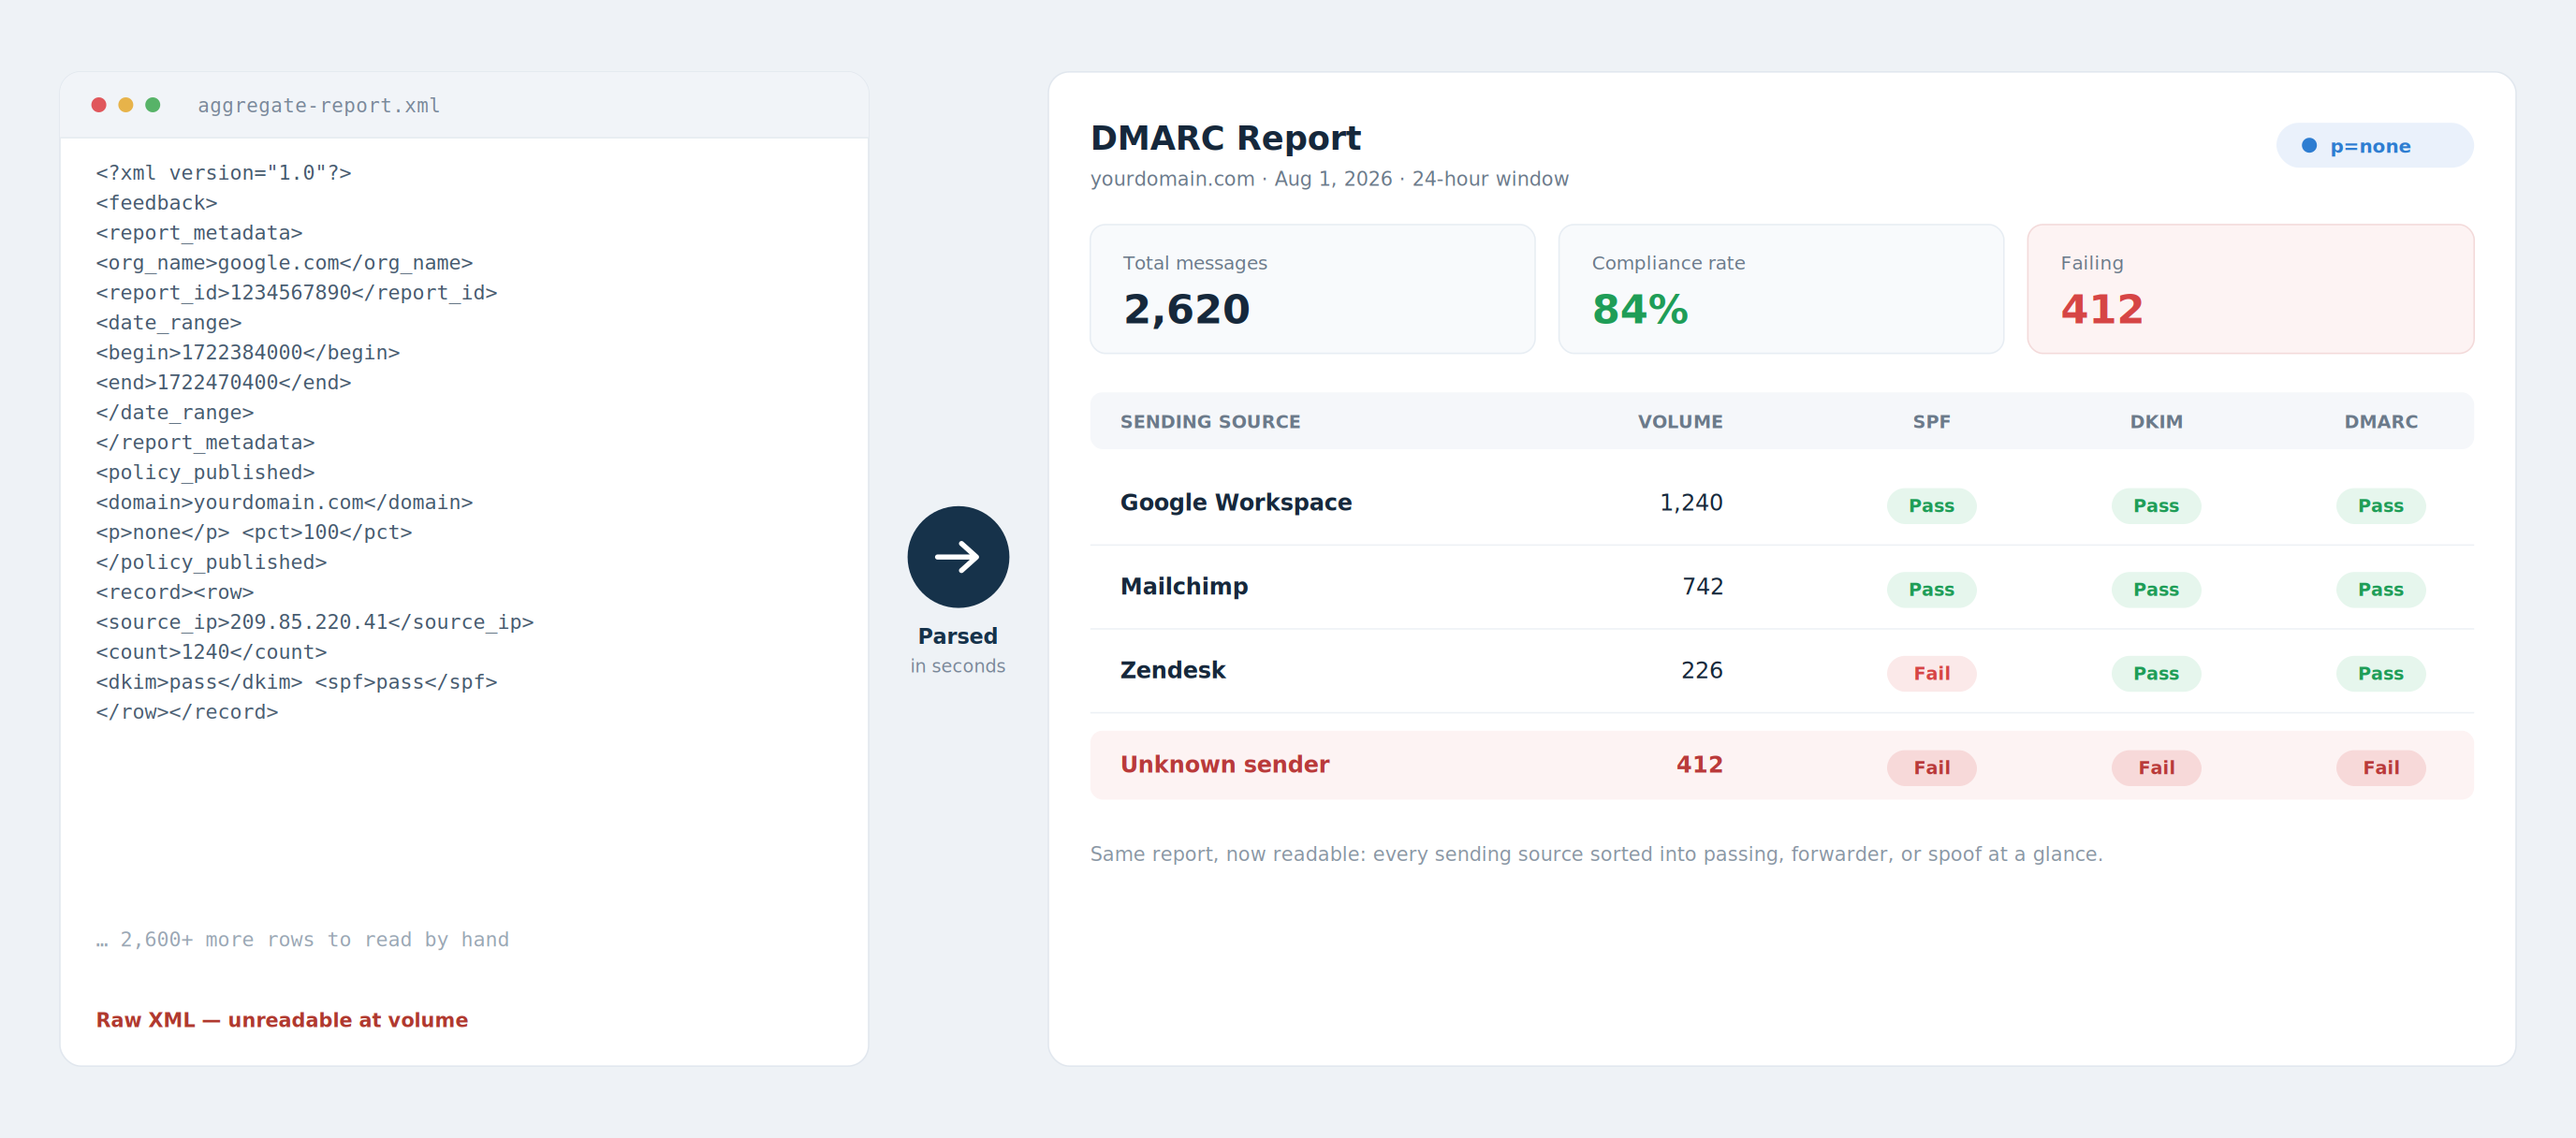
Doing that by hand across thousands of rows is where it falls apart — which is why most people feed the XML into a parser. You can paste a raw report into our free DMARC XML analyzer to turn it into a readable table in seconds.
Making sense of the data: what to look for
Once you can read a single record, analyzing the full set comes down to a few patterns.
Authentication vs alignment. A message can pass SPF yet still fail DMARC if the authenticated domain doesn't match the From domain. That's alignment. When policy_evaluated shows a pass but auth_results looks fine and DMARC still fails elsewhere, alignment is usually the culprit.
Forwarders will break SPF — don't panic. When mail is forwarded (mailing lists, .forward rules), the forwarding server's IP replaces the original, so SPF fails. This is normal and not spoofing. DKIM survives forwarding, so DKIM alignment is your reliable signal here. Misreading forwarded mail as an attack is the most common analysis mistake.
Unknown sources are the priority. Any sending IP you can't identify falls into two groups: a legitimate service you forgot about (a CRM, a helpdesk, a payment processor), or an actual spoofer. Track each one down before you tighten your policy.
Compliance rate is your headline number. This is the share of your mail that passes DMARC — add up the count of all passing, aligned messages and divide by the total count across every record. It's the single metric that tells you whether you're ready to enforce, and you want it consistently high across all your legitimate senders before moving off p=none.
From reports to action: tightening your policy
Analysis is only useful if it changes your policy. The reports drive a simple loop.
- Inventory every sending source. List each IP and match it to a service. If you find a legitimate sender that's failing, fix its SPF or DKIM setup — you may need to generate or update an SPF record or add a DKIM key.
- Get every legitimate sender to pass and align. Don't move forward until your known senders are green.
- Move to
p=quarantine. Once compliance is high, step up fromnonetoquarantine, often with a lowpctfirst, and keep reading the reports. - Move to
p=reject. When quarantine runs clean, go to full enforcement. This is the point where spoofed mail is actually blocked. - Keep monitoring. New senders get added over time. Reports aren't a one-time read — a new tool or vendor can quietly start sending as your domain next month.
Common mistakes when analyzing DMARC reports
- Reading raw XML by hand at scale. Fine for one report, unworkable across dozens of providers and thousands of rows. Use a parser or monitoring service.
- Jumping to
p=rejectbefore the reports are clean. This bounces legitimate mail from forwarders and forgotten senders. Enforce only after your known sources pass. - Treating forwarded mail as an attack. SPF failing on a forwarder is expected. Check DKIM alignment before flagging anything as spoofing.
- Reading reports once and stopping. Sending sources change. A quarterly-only glance misses new senders and new abuse.
- Ignoring low-volume unknown IPs. A spoofing test often starts small. Don't dismiss a source just because its
countis low.
Frequently asked questions
How often do DMARC reports arrive?
Aggregate reports are typically sent once every 24 hours by each receiving provider, so you'll get a separate daily report from Google, Microsoft, Yahoo, and others. Failure reports, when a provider sends them at all, arrive close to the time of the failure.
Where are DMARC reports sent?
They're sent to the email addresses in your DMARC record — the rua tag for aggregate reports and the ruf tag for failure reports. If those tags are missing, you won't receive anything, which is why confirming your record is the first step.
Can I read DMARC reports without a tool?
Yes, for a single report — the XML is human-readable once you know the fields. But volume makes manual reading impractical fast, since a single domain can receive thousands of records a month across many providers. A parser or monitoring platform turns the XML into a readable summary.
What is the difference between aggregate and failure reports?
Aggregate reports (rua) are daily XML summaries of all your sending activity, with counts and authentication results but no message content. Failure reports (ruf) contain detail about individual messages that failed and can include personal data, so many providers no longer send them.
What is a good DMARC compliance rate?
Aim for as close to 100% of your legitimate mail passing DMARC as you can get before enforcing. There's no fixed threshold, but you want every known sender authenticated and aligned so that moving to quarantine or reject won't block real email.
The bottom line
Reading DMARC reports is the difference between guessing and knowing. The aggregate report maps every source sending mail as your domain; once you can decode the fields and sort senders into passing, failing, and unknown, you can tighten your policy toward p=reject without breaking legitimate email.
You don't have to read the XML by hand. SimpleDMARC turns your raw reports into clear dashboards and flags the sources that need attention. Start free DMARC monitoring at simpledmarc.com — no credit card, and your first reports become readable within minutes.